Python Apis: Part2
Author: R Zach FeeserContinuing with code to screen iterations using a “turtle”, we take a further look at tracking the International Space Station (ISS). Python has a “Turtle Graphics Module” that is built on top of Tkinter, which is a more powerful, general purpose Python library for building GUIs (Graphical User Interfaces). Using this library, we will set the background as a world map of the planet Earth, replace the “turtle” with an International Space Station (ISS) icon, and then tell our new ISS-turtle to move according to real-time data provided by a RESTful API that tracks the actual location of the orbiting ISS. In part two of working with APIs, we continue to improve our code - highlighting the Space Station and alerting us to when the ISS is actually overhead.
Step 1 - Prerequisites to Perform this task.
- Install latest version of Python (python3.X)
- Ubuntu 16.04 or greater.
- Map to show International Space Station
- International Space Station :)
- Do Using Python to Interact with APIs (Part 1)
Step 2 - Take a look at your web resource.
Open a browser tab to
http://api.open-notify.org/iss-pass.json?lat=40.2&lon=-76.6
Step 3 - Create your updated python script and review!
You can do this with any of your favorite editors like vim, nano, or emacs. Here we use leafpad.
student@bchd:~/apicode$ leafpad apicode03.py
import time
import turtle
import urllib.request
import json
## Trace the ISS - earth-orbital space station
eoss = 'http://api.open-notify.org/iss-now.json'

## Call the webserv
trackiss = urllib.request.urlopen(eoss)

## put into file object
ztrack = trackiss.read()

## json 2 python data structure
result = json.loads(ztrack.decode('utf-8'))

## display our pythonic data
print("

Converted python data")
print(result)
input('
ISS data retrieved & converted. Press the ENTER key to continue')

location = result['iss_position']
lat = location['latitude']
lon = location['longitude']
print('
Latitude: ', lat)
print('Longitude: ', lon)

screen = turtle.Screen() # create a screen object
screen.setup(720, 360) # set the resolution

screen.setworldcoordinates(-180,-90,180,90)

screen.bgpic('iss_map.gif')

screen.register shape('spriteiss.gif')
iss = turtle.Turtle()
iss.shape('spriteiss.gif)
iss.setheading(90)

lon = round(float(lon))
lat = round(float(lat))

iss.penup()
iss.goto(lon, lat)

## My location
yellowlat =40.2
yellowlon = -76.6
mylocation = turtle.Turtle()
mylocation.penup()
mylocation.color('yellow')
mylocation.goto(yellowlon, yellowlat)
mylocation.dot(5)
mylocation.hideturtle()

passiss = 'http://api.open-notify.org/iss-pass.json'
passiss = passiss + '?lat=' + str(yellowlat) + '&lon=' + str(yellowlon)
response = urllib.request.urlopen(passiss)
result = json.loads(response.read().decode('utf-8'))

## print(result) ## uncomment to see the downloaded result
over = result['response'][1]['risetime']
style = ('Arial', 6, 'bold')
mylocation.write(time.ctime(over), font=style)
turtle.mainloop() # <-- this line should ALWAYS be at the bottom of your script. It prevents the graphic from closing.
Step 4 - Run your python code!
student@bchd:~/apicode$ python3 apicode03.py
Converted python data
{'timestamp': 1532358137, 'iss_position': {'longitude': '-160.0826', 'latitude': '12.7211'}, 'message': 'success'}

ISS data retrieved & converted. Press the ENTER key to continue

Latitude:  12.7211
Longitude: -160.0826
Step 5 - Take a look at the Map that shows where the International Space Station is at the Moment! Awesome!
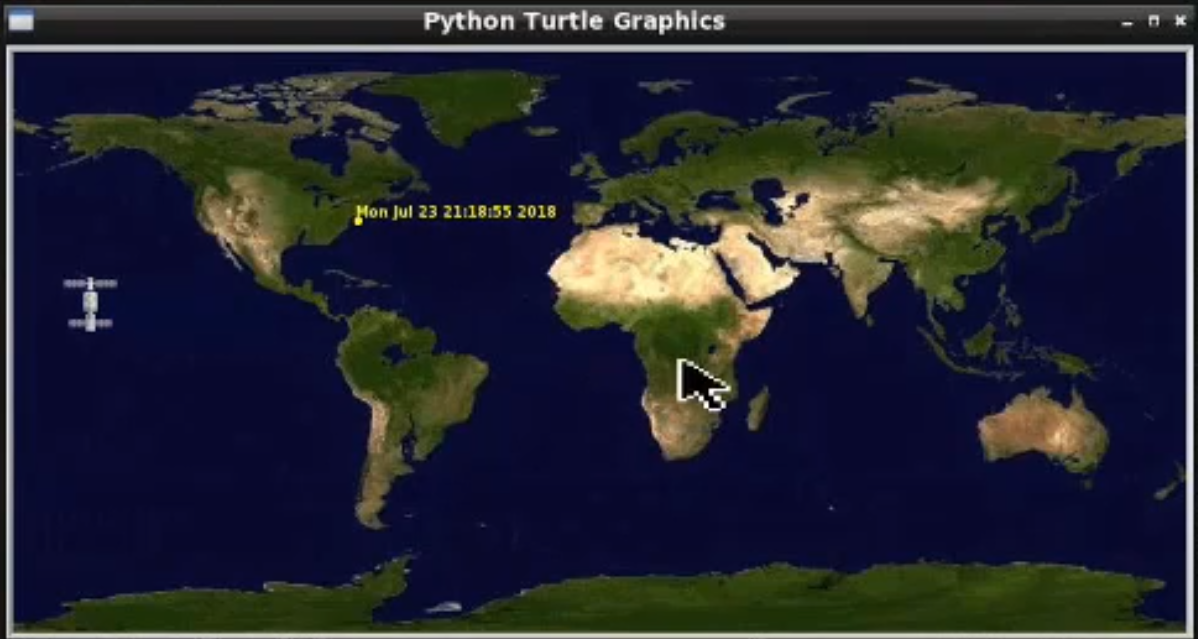
Explore more Python API studies with Alta3 Research!